Curves Tool
-
Menu -> Image -> Curves
-
Curves Tool
-
The Curves tool is the most sophisticated tool used to adjust the
tonality of images.
-
-
Adjust Color Curves
-
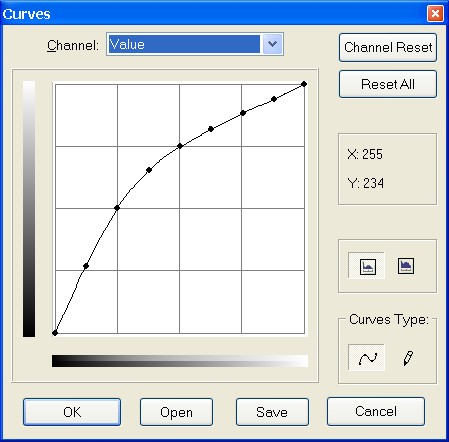
Channel
-
There are four options: Value for luminosity and contrast; Red,
Green, and Blue for saturation.
-
-
Reset Channel
-
This button deletes all changes made to the selected channel.
-
-
Reset All
-
This button deletes all changes made to the all channels.
-
-
Main Editing Area Input and Output Value Domains:
-
The horizontal bar (x-axis) represents input values (they are value
levels from 0 to 255).
-
The vertical bar (y-axis) is only a scale for output colors of the
selected channel.
-
-
The control curve is drawn on a grid and goes from bottom left
corner to top right corner. Pointer x/y position is permanently
displayed in top left part of the grid. If you click on the curve, a
Control point is created. You can move it to bend the curve. If you
click outside of the curve, a control point is also created, and the
curve includes it automatically.
-
-
So, each point of the curve represents an 'x' level, corresponding
to an 'y' color. If, for example, you move a curve segment to the
right, id est to highlights, you can see that these highlights are
corresponding to darker output tones and that image pixels
corresponding to this curve segment will go darker. With color
channels, moving right will decrease saturation and can reach the
complementary color.
-
-
To delete all control points (apart from both ends), click on the
Reset Channel button. To delete only one point, move it onto another
point or to grid border.
-
-
Linear and Logarithmic buttons

-
These buttons allow to choose the Linear or Logarithmic type of the
histogram.
-
-
Curve Type

 Smooth: This mode constrains the curve type to a smooth line with
tension. It provides a more realistic render than the following.
Smooth: This mode constrains the curve type to a smooth line with
tension. It provides a more realistic render than the following.-
Free: You can draw your curve free-hand with the mouse. With curve
segments scattered all over the grid, result will be surprising, but
poorly repeatable.
- Open
-
This button allows you to select a file holding curve settings.
-
-
Save
-
This button allows you to save any curves settings you have set to a
file that can be loaded later.